Vietnam & Global Coffee and Cashew Markets Q1 2026
Vietnam’s two flagship export commodities delivered strong volume growth in Q1 2026, but both sectors face the same structural paradox: exports are rising while unit prices fall. This report examines the data, the drivers, and what lies ahead for Q2–Q4 2026.
1. Executive Summary
Q1 2026 marks a pivotal inflection point for Vietnam’s two most strategic agricultural export sectors. Both coffee and cashew delivered robust double-digit volume growth, yet both face a common structural paradox: volumes expanded while unit values contracted, signaling a global supply rebalancing that will define the rest of 2026.
Vietnam’s coffee exports surged to 577,300 metric tons in Q1 2026 (+12.6% year-on-year in volume), yet total export value declined 6.4% to USD 2.71 billion as the average export price fell 16.9% to USD 4,697/ton. The cashew sector held up better: kernel exports reached 139,865 metric tons (+11.8% YoY) generating USD 953.5 million (+10.9%), with unit prices relatively stable at USD 6,802/ton (−1% YoY).
| Metric | Value | YoY Change |
|---|---|---|
| Coffee export volume (Q1 2026) | 577,300 MT | +12.6% (volume) |
| Coffee export value (Q1 2026) | USD 2.71 billion | −6.4% (value) |
| Coffee avg. unit price | USD 4,697/ton | −16.9% |
| Cashew kernel export volume (Q1 2026) | 139,865 MT | +11.8% (volume) |
| Cashew export value (Q1 2026) | USD 953.5 million | +10.9% (value) |
| Cashew avg. unit price | USD 6,802/ton | −1.0% |
2. Coffee Market: Q1 2026 Performance
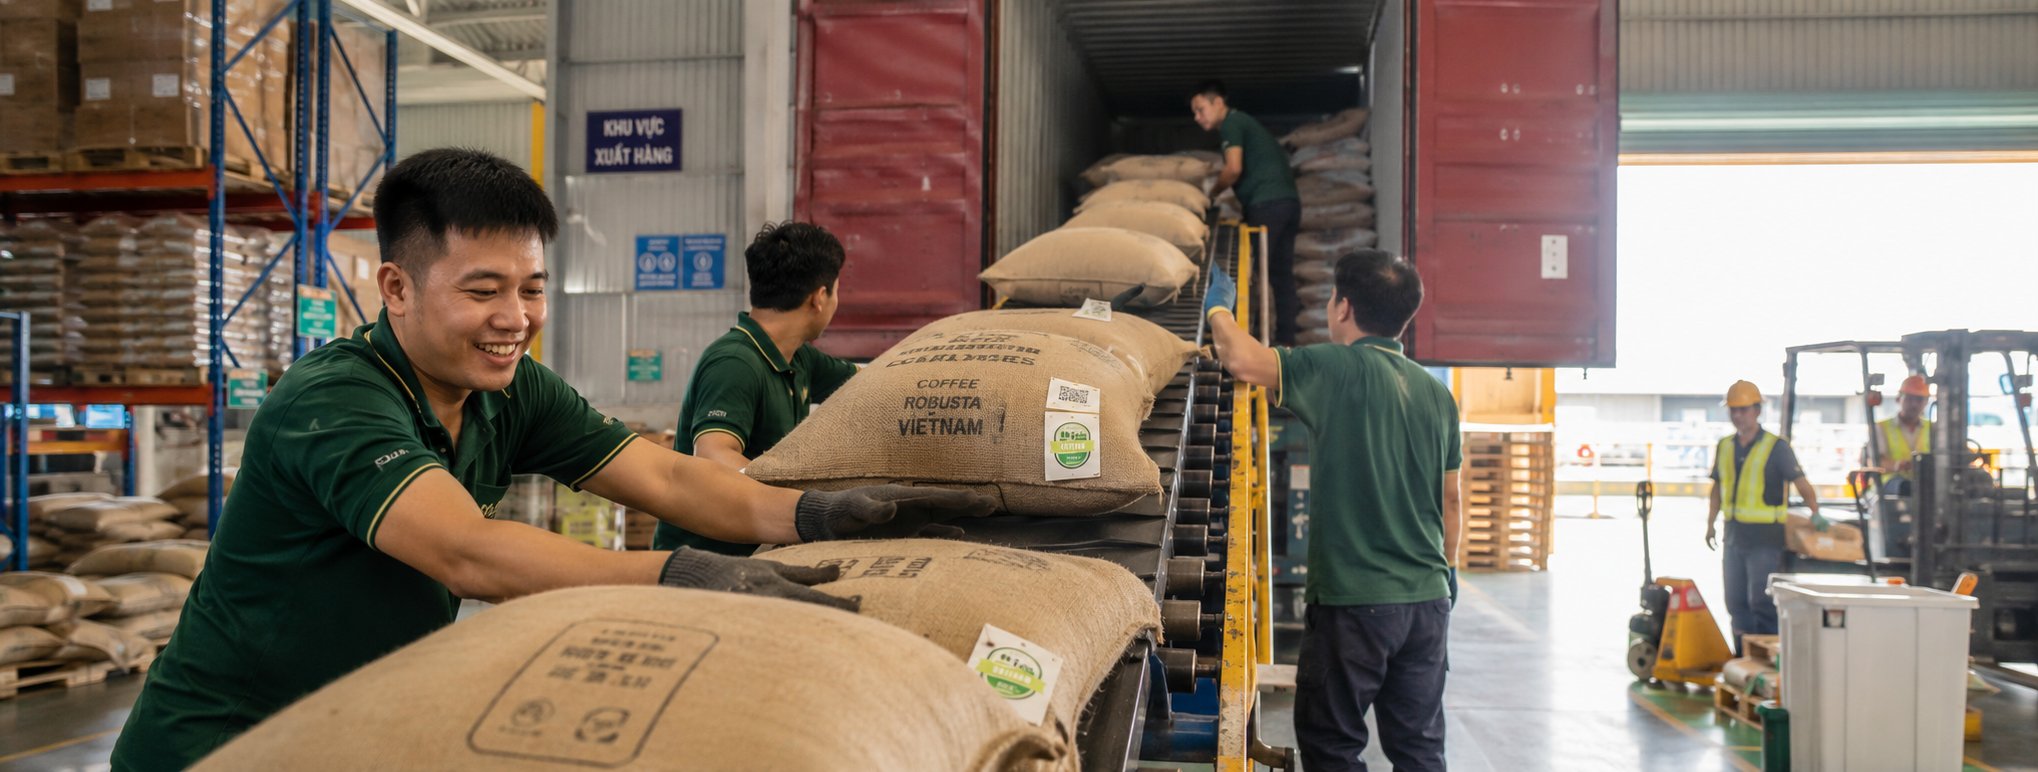
2.1 Vietnam’s Export Performance
Vietnam delivered one of its strongest first-quarter volume performances in recent history, exporting 577,300 metric tons between January and March 2026. This 12.6% year-on-year volume increase was underpinned by a strong 2025/26 crop season — expected to produce approximately 10% more output than the prior season — and by the resolution of earlier harvest delays that shifted export volumes into the current period.
January 2026 alone saw Vietnam ship more than 224,000 tons, generating approximately USD 1.08 billion — a historically exceptional single-month performance. By end of February, cumulative two-month exports reached 366,000 metric tons, up 14% year-on-year. The quarter closed with 577,300 tons and USD 2.71 billion in revenue.
The average export unit price fell 16.9% to USD 4,696.8 per ton, compared with Q1 2025 — a direct reflection of the global supply rebalancing underway following peak prices in early 2025, when London Robusta futures hit an all-time high of USD 5,821/ton in February 2025. The divergence between volume growth and value decline is the dominant narrative of Q1 2026: Vietnam is shipping more coffee than ever, but receiving significantly less per ton.
2.2 Export Destination Dynamics
Germany, Italy, and Spain retained their positions as the three largest destination markets. Europe collectively accounts for approximately 41% of Vietnam’s coffee shipments. A strategically significant development was the marked surge in Chinese import volumes from Vietnam, driven by rapid urbanization, explosive café chain growth, and evolving consumer preferences among younger demographics. Conversely, the Philippines recorded a decline in Q1, while Singapore reinforced its role as a regional transit hub.
| Market | Q1 2026 Trend | YoY Change | Notes |
|---|---|---|---|
| EU (Germany, Italy, Spain) | Largest bloc | +8% est. | EUDR compliance required from Jan 2026 |
| China | Significant surge | Strong growth | Café culture boom; RTD demand rising fast |
| United States | Moderate | Stable | Monitor tariff risk trajectory |
| Japan / South Korea | Consistent | +5% est. | Premium RTD and instant segments |
| Philippines | Declined | Negative YoY | Likely temporary; monitor closely |
2.3 EUDR: Compliance Requirement Turned Competitive Advantage
The EU Deforestation Regulation (EUDR), which took effect January 1, 2026, now requires European roasters sourcing Vietnamese coffee to demonstrate farm-level geotraceability and deforestation-free certification. Vietnam entered this regulatory era in a position of relative preparedness — covering an estimated 60–70% of Central Highlands growing regions before the compliance deadline. This positions Vietnamese Robusta as a preferred sourcing origin for EU roasters and is accelerating industry consolidation around compliant processors.
3. Global Coffee Market: Supply Rebalancing Underway
The global coffee market entered Q1 2026 in what analysts characterize as a fragile correction phase following two years of historic price peaks. The ICO Composite Indicator Price (I-CIP) averaged 267.57 US cents/lb over the quarter before edging up 2.3% in March 2026 to 273.70 cents/lb — suggesting the downtrend was losing momentum by quarter-end.
Global green bean coffee exports reached 10.85 million bags in January 2026, up 12.7% year-on-year. Robusta exports dominated this growth, surging 49.1% to reach 5.25 million bags — with Vietnam leading at a 73.3% volume increase to 3.69 million bags in January alone. This structural shift — Robusta gaining market share from Arabica — has persisted for three consecutive months, reflecting a fundamental realignment of global coffee trade flows rather than a temporary fluctuation.
On the supply side, the World Bank forecasts global coffee production to increase from 175.4 million bags in the 2024/25 season to approximately 179 million bags in 2025/26. Brazilian production in 2026/27 is projected at a potentially record 66.2–71 million bags, benefiting from the Arabica biennial on-year cycle and exceptional flowering conditions. Arabica prices are projected to decline 13% across 2026; Robusta is expected to ease more gradually — approximately 2% — reflecting different supply dynamics in Southeast Asian origins.
| Metric | Q1 2025 | Q1 2026 | Change |
|---|---|---|---|
| Vietnam export volume | ~512,000 MT | 577,300 MT | +12.6% |
| Vietnam export value | ~USD 2.90B | USD 2.71B | −6.4% |
| Avg. unit export price | USD 5,650/ton | USD 4,697/ton | −16.9% |
| Jan export volume (Vietnam) | ~129,000 MT | 224,000 MT | +73.6% |
| ICO Composite Price (avg) | ~395 cents/lb | ~268 cents/lb | −32% |
| Global Robusta exports (Jan) | 3.52M bags | 5.25M bags | +49.1% |
4. Cashew Market: Q1 2026 Performance
4.1 Vietnam’s Export Performance
Vietnam’s cashew kernel export sector delivered a remarkably resilient first quarter, posting double-digit growth in both volume and value. According to VINACAS, Vietnam exported 139,865 metric tons of cashew kernels in Q1 2026 — an 11.8% increase year-on-year — generating USD 953.5 million (+10.9% in value). The average export price held steady at USD 6,802/ton, just 1% below Q1 2025 — a significantly better price-stability outcome than witnessed in the coffee sector.
January 2026 was particularly strong: 65,000 tonnes valued at USD 434 million — a sharp increase versus the same month in 2025, reflecting accumulated buyer confidence following record 2025 annual exports of USD 5.229 billion and strategically timed pre-Lunar New Year procurement cycles.
4.2 The US Market Resurgence
One of the most strategically significant findings of Q1 2026 is the dramatic recovery of the United States as Vietnam’s top cashew market. Following a turbulent 2025 in which US-bound shipments collapsed 27.5% in volume — driven by uncertainty over potential countervailing duties announced in April 2025 — the US market rebounded sharply, with shipment volume and value rising 29.7% and 30.3% respectively year-on-year. Vietnam commands over 87% of US cashew import market share.
In 2025, China surpassed the US for the first time in over a decade to become Vietnam’s largest cashew market (China: USD 1.115B vs. US: USD 975M). The Q1 2026 US resurgence temporarily reverses this. The long-run trajectory, however, clearly favors China — driven by 5% annual growth in tree-nut consumption and a per-capita cashew intake expected to nearly double by 2030.
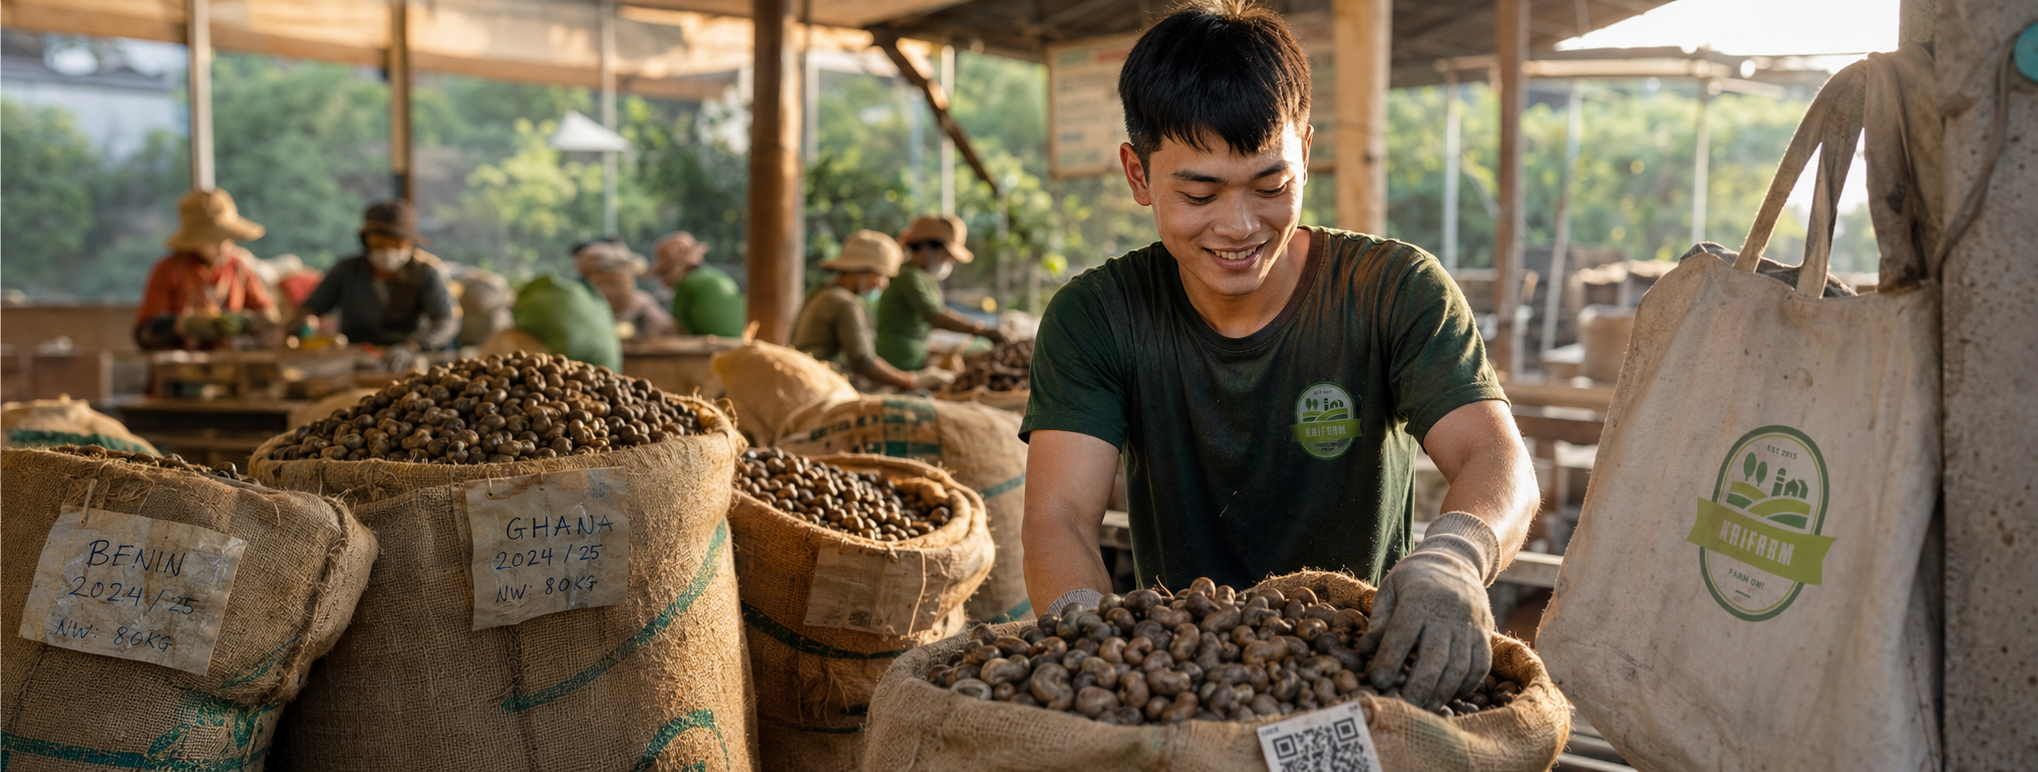
4.3 Raw Material Supply Pressures
Despite strong exports, Q1 2026 has intensified a structural vulnerability: Vietnam’s near-total dependence on imported raw cashew nuts (RCN). Domestic supply meets only approximately 10% of processing capacity, with the remaining 90% sourced primarily from West Africa (Côte d’Ivoire 25.3%, Nigeria 9.3%, Ghana 7.7%) and Cambodia (32.9%). In Q1 2026, raw cashew imports exceeded USD 1 billion (+13.1% YoY), with RCN prices rising to USD 1,900–2,000/ton — up 35–45% from a year earlier — squeezing margins especially for smaller processors.
In 2025, Vietnam spent USD 4.5 billion importing more than 2.9 million tonnes of raw cashews, yielding a trade surplus of just USD 700 million on USD 5.2 billion in export revenue — a thin 13.4% net margin that underscores the urgency of domestic cultivation recovery programs.
| Metric | Q1 2025 | Q1 2026 | Change |
|---|---|---|---|
| Export volume (kernels) | 125,100 MT | 139,865 MT | +11.8% |
| Export value | USD 859.8M | USD 953.5M | +10.9% |
| Avg. unit price | USD 6,872/ton | USD 6,802/ton | −1.0% |
| US market volume growth | −27.5% (vs. 2024) | +29.7% | Sharp recovery |
| China volume | Strong (H2 2025 peak) | Seasonal decline | Lunar New Year effect |
| Raw cashew imports value | ~USD 880M | >USD 1.0B | +13.1% |
| RCN market price | USD 1,100–1,400/ton | USD 1,900–2,000/ton | +35–45% |
5. Global Cashew Market: Dominance Under Pressure
The global cashew market reached an estimated USD 10.57 billion in 2026 (up from USD 9.9 billion in 2025), projected to grow at a 6.74% CAGR through 2031. Vietnam controls over 80% of global cashew kernel export volume — a dominance underpinned by its 52% kernel recovery rate (via AI-guided optical sorting), established trade relationships, and logistical scale. Vietnam has held this leadership position for 19 consecutive years.
However, structural threats are intensifying. Côte d’Ivoire’s locally processed cashew exports surged 67% in 2025 to an estimated USD 623 million. Cambodia, previously a raw material supplier, is developing its own processing capacity backed by a 1.1 million MT annual RCN production base. India competes directly in US and European premium-grade markets. The global cashew value chain is gradually restructuring, with producing nations retaining more processing within their borders — a long-cycle risk that will intensify through 2027–2030.
6. Q2–Q4 2026 Forecasts
6.1 Coffee Forecast
Q2 2026 — Moderately Positive Volume; Price Pressure Persists
- Brazil’s 2026/27 harvest enters active monitoring phase; early forecasts project 66–71M bags — potential record output.
- ICO Composite Indicator Price likely softens further toward 250–260 cents/lb as Brazilian supply signals strengthen.
- Vietnam export volumes estimated at 400,000–430,000 MT for the quarter.
- EUDR traceability requirements begin creating procurement-level friction, benefiting compliant origins like Vietnam.
- Farm-gate prices in Dak Lak/Lam Dong expected range: VND 85,000–92,000/kg; cautious farmer selling posture.
Q3 2026 — Price Trough Likely; Volume Seasonally Lower
- Peak Brazilian harvest shipments flood the market (July–September): maximum Arabica supply pressure.
- Arabica prices could test USD 2.50–2.70/lb support zone; Robusta to hold near USD 1.65–1.75/lb.
- Chinese RTD coffee demand peaks; European roasters begin Q4 forward-buying.
- Vietnam export volumes seasonally lower: ~340,000–370,000 MT before Q4 harvest surge.
Q4 2026 — Recovery Phase; Specialty Segment Outperforms
- Vietnam’s 2026/27 crop harvest begins (October); output estimated at 30–31 million bags.
- ICO prices stabilize and partially recover; expected range 265–285 cents/lb.
- Holiday season demand in Europe and US supports roaster procurement activity.
- Fine/Specialty Robusta commands 25–40% premium over commodity-grade Robusta.
6.2 Cashew Forecast
Q2 2026 — West Africa Harvest Season; Tight RCN Supply
- Côte d’Ivoire RCN harvest peaks April–June; weather-related dryness may reduce output versus prior year.
- RCN prices expected to remain elevated at USD 1,900–2,100/ton; potential spike to USD 2,200 if crop disappoints.
- China demand recovers from Lunar New Year lull; pre-season stocking for Mid-Autumn Festival begins.
- Expected Q2 cashew kernel exports: 170,000–185,000 MT (~USD 1.15–1.25 billion).
Q3 2026 — Demand Peak; Mid-Autumn Festival Season
- China’s Mid-Autumn Festival (mid-October) drives peak cashew demand; orders front-load into August–September.
- US back-to-school and early holiday season pre-procurement begins.
- W320 kernel prices: ~USD 6,700–7,000/ton; W180 premium grades: USD 8,500–9,500/ton.
- Expected Q3 exports: 200,000–220,000 MT (~USD 1.35–1.55 billion) — the year’s largest quarter.
Q4 2026 — Holiday Surge; Annual Target Under Test
- Christmas/New Year demand in Europe and US drives the year’s second export peak.
- VINACAS 2026 target of USD 5.0 billion achievable but challenging given geopolitical headwinds.
- African processing competition accelerates (Côte d’Ivoire, Benin, Tanzania).
- Expected Q4 exports: 200,000–215,000 MT (~USD 1.35–1.45 billion).
6.3 Full-Year 2026 Forecast Summary
| Commodity | 2025 Actual | Q1 2026 Actual | 2026 Base Case | Bull Case | Bear Case |
|---|---|---|---|---|---|
| Coffee — Export Volume | ~1.8M MT | 577K MT | 1.95–2.05M MT | 2.1M MT | 1.8M MT |
| Coffee — Export Value | ~USD 5.5B | USD 2.71B | USD 8.5–9.5B est. | >USD 10B | USD 7.5B |
| Coffee — Avg. Unit Price | ~USD 5,630/ton | USD 4,697/ton | USD 4,200–4,600/ton | USD 4,800/ton | USD 3,800/ton |
| Cashew — Export Volume | 766,585 MT | 139,865 MT | 750,000–800,000 MT | 820,000 MT | 700,000 MT |
| Cashew — Export Value | USD 5.229B | USD 953.5M | USD 4.8–5.0B | USD 5.3B | USD 4.3B |
| Cashew — Avg. Unit Price | ~USD 6,820/ton | USD 6,802/ton | USD 6,600–7,000/ton | USD 7,200/ton | USD 6,100/ton |
7. Key Risk Factors for Q2–Q4 2026
High Risk: Global Coffee Price Deflation
Record Brazilian production (66–71M bags) flooding markets in H2 2026 could push Arabica below USD 2.50/lb and drag Robusta toward USD 1.60/lb, further compressing Vietnam’s export revenue per ton despite high volumes. The volume/value divergence seen in Q1 may intensify.
High Risk: Raw Cashew (RCN) Supply Chain Disruption
West African supply tightness and export restriction policies from producing nations (minimum prices, temporary bans) could spike RCN costs to USD 2,200+/ton, severely compressing processor margins and threatening Vietnam’s 90% import-dependent processing model.
High Risk: US Tariff & Trade Policy Uncertainty
Vietnam’s 46% proposed tariff rate (paused but unresolved) creates sustained procurement hesitation among American buyers. A full imposition could replicate the 2025 export collapse to the US market, impacting both coffee and cashew revenue significantly.
Medium Risk: Red Sea / Suez Shipping Disruptions
Ongoing Middle East geopolitical instability continues to drive elevated freight costs on Asia–Europe trade lanes, adding USD 150–300/ton in effective logistics costs and directly impacting net export margins.
Medium Risk: EUDR Compliance Exclusion Risk
An estimated 30–40% of Central Highlands coffee farm area remains without full geotraceability certification. Non-compliant supply chains risk losing EU market access — threatening the sector’s largest customer bloc (41% of exports).
Medium Risk: African Processing Capacity Expansion
Côte d’Ivoire, Benin, Tanzania, and Nigeria are all investing in domestic cashew kernel processing. This long-cycle risk could reduce raw material availability for Vietnamese processors while creating new kernel export competitors in EU and US markets by 2028–2030.
Low Risk: Vietnam Domestic Production Recovery (Upside)
Both coffee (+10% crop) and cashew (replanting programs) domestic production are recovering. If output exceeds forecast, export costs fall and margins improve. Each 1% increase in domestic cashew self-sufficiency materially reduces RCN import cost pressure.
8. Strategic Outlook for the Remainder of 2026
Coffee: Quality Premiumization & Traceability
The Q1 2026 price trajectory confirms that commodity-grade Robusta will face sustained pressure through 2026. The strategic response is clear: accelerate the transition toward Fine Robusta and specialty-grade production under the Robusta XXI framework. Fine Robusta commands 25–40% price premiums over standard Grade 2 Robusta. Completing farm-level EUDR geotraceability mapping is equally essential to protect access to the EU market — Vietnam’s largest coffee customer bloc accounting for 41% of shipments.
Cashew: Supply Chain Sovereignty & Deep Processing
Vietnam’s near-total RCN import dependency creates two parallel imperatives. First, active participation in domestic replanting programs for the Central Highlands and Southeast regions. Second, investment in higher-value-added processing: W180 and W240 kernel production, organic certification, flavored/roasted formats, and cashew-based ingredients (butter, milk) to extract greater revenue per ton. W180 volumes surged 92.8% YoY in 2025; W240 rose 36% — this premium-grade shift should be the processing priority for 2026.
Market Diversification
Both sectors require active market diversification to reduce binary exposure to the US–China trade policy environment. For coffee: priority markets are the growing affluent Chinese consumer segment and Middle Eastern markets (6%+ annual growth). For cashew: the Middle East (Saudi Arabia, UAE), India’s organized snack retail sector, and emerging Southeast Asian consumer markets (Indonesia, Thailand) represent underpenetrated, high-growth demand pools warranting dedicated trade development investment in 2026.
Priority Actions for H2 2026
- Complete farm-level EUDR geotraceability mapping for 100% of coffee supply base.
- Secure multi-year RCN supply contracts with West African and Cambodian counterparties at locked-in pricing.
- Commission fine/specialty processing capacity expansion to handle a minimum 15,000 MT/year in premium grades.
- Initiate direct-trade partnerships in China (coffee) and the Middle East (cashew).
- Apply for USDA Organic and Fairtrade certification for at least one product line per commodity.
Sources: International Coffee Organization (ICO) · Vietnam Cashew Association (VINACAS) · General Department of Vietnam Customs · USDA Foreign Agricultural Service · World Bank Commodity Price Forecasts · Helena Coffee Vietnam · DTI News / VietnamPlus · Mordor Intelligence · CropGPT · QahwaWorld · MP Logistics Vietnam
This report is produced by KAI Farm’s Analytics Division for informational purposes. Market forecasts are indicative and subject to revision based on evolving conditions. Published May 2026.
Hoang Tuan
Data Analysis Team, KAIFarm®
People
People
Story
Story
Story
Story